[ad_1]
On December 29, at lunchtime, not far from the southern borders of Hungary, an earthquake measuring 6.4 on the Richter scale was unleashed, the effect of which was also felt in Hungary. The epicenter of the earthquake was about 50 km southeast of the Croatian capital, Zagreb. There have been major earthquakes in the area the day before and since.
Such an earthquake is extremely rare in our area, essentially representing a magnitude close to the maximum possible in terms of the tectonics and rheology of our immediate surroundings. Seven people lost their lives as a result of the disaster. There was serious material damage in almost a hundred localities. Parts of the small town of Petrinja in Croatia have collapsed.
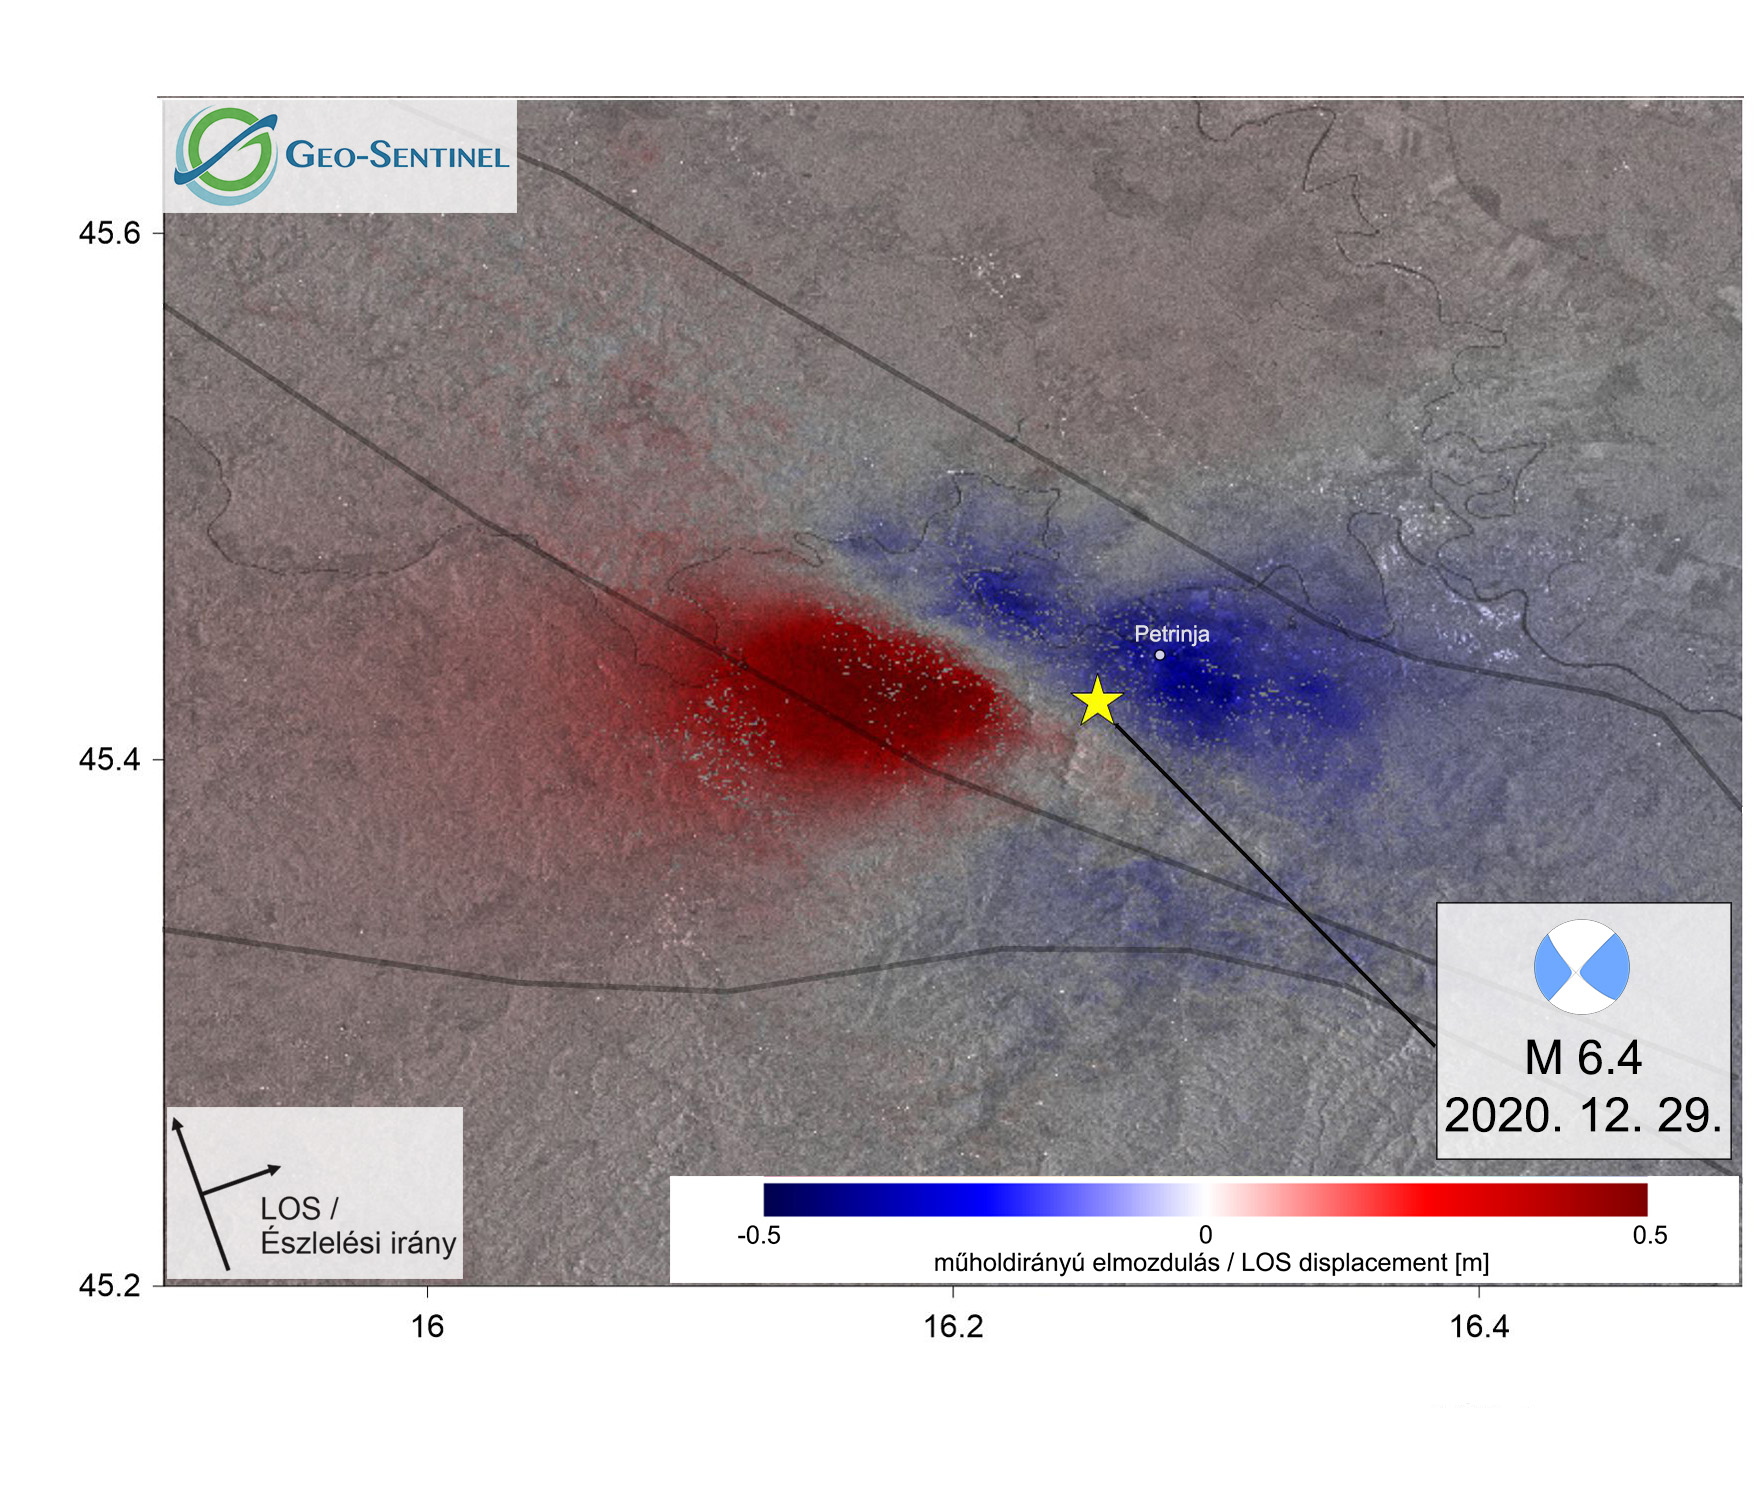
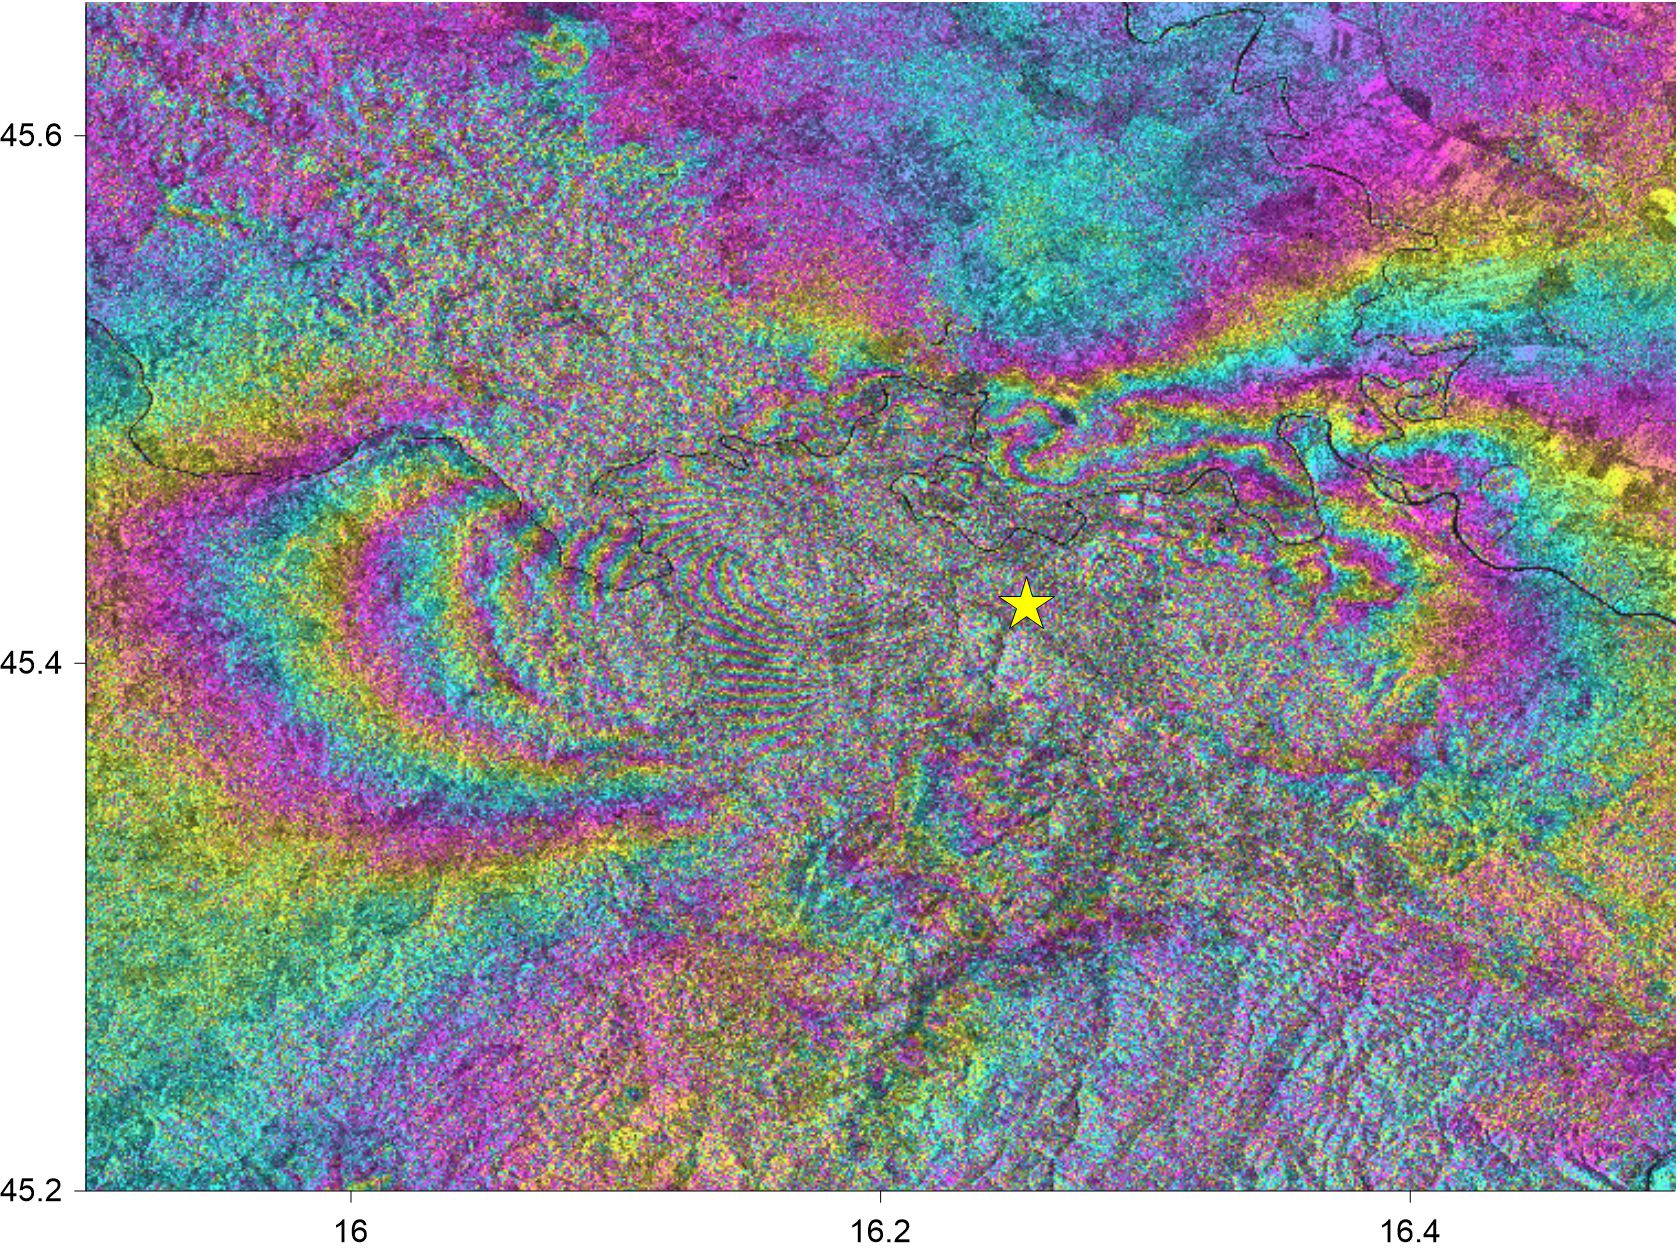
Probably the first in Hungary, but also among the first in the world, the Geo-Sentinel Kft experts mapped the displacements caused by the earthquake in Croatia and the permanent deformation of the surface.

Interferometric processing of observations from the Sentinel-1 aperture synthesis radar pair of satellites of the European Earth observation program Copernicus enables the detection of movements on the surface. The essence of the interferometer method is that a very detailed and accurate map of the displacement can be produced from the phase information of radar measurements in the same area before and after the earthquake.

The Sentinel-1A satellite flew over the area on December 30, the day after the disaster, in takeoff orbit (i.e., south-north). The interferometric comparison of the phase data was performed in observations made the day after the earthquake and 12 days before, on December 18. Subsequently, satellite radar measurements in the other direction of flight will allow the spatial components of the displacements to be determined more precisely.
[ad_2]